Updated annual volatility for 2024

My undergraduate student Angel Piotrowski updated annual realized volatility for 2024. Previously she computed it for 1928-2023, each year. She took log change in daily closing prices of the Standard & Poor 500, or its predecessor, Standard & Poor 90, and computed empirical standard deviation. Given this annual volatility data  V(t) she analyzed this. First, she computed the autocorrelation function for  V(t).

This strongly suggests using the autoregression model, which is called the Heston model in quantitative finance:

 V(t) = \alpha + \beta V(t-1) + W(t).

Results after fitting this simple linear regression using ordinary least squares method are:

 \alpha = 0.003920,\, \beta = 0.626196

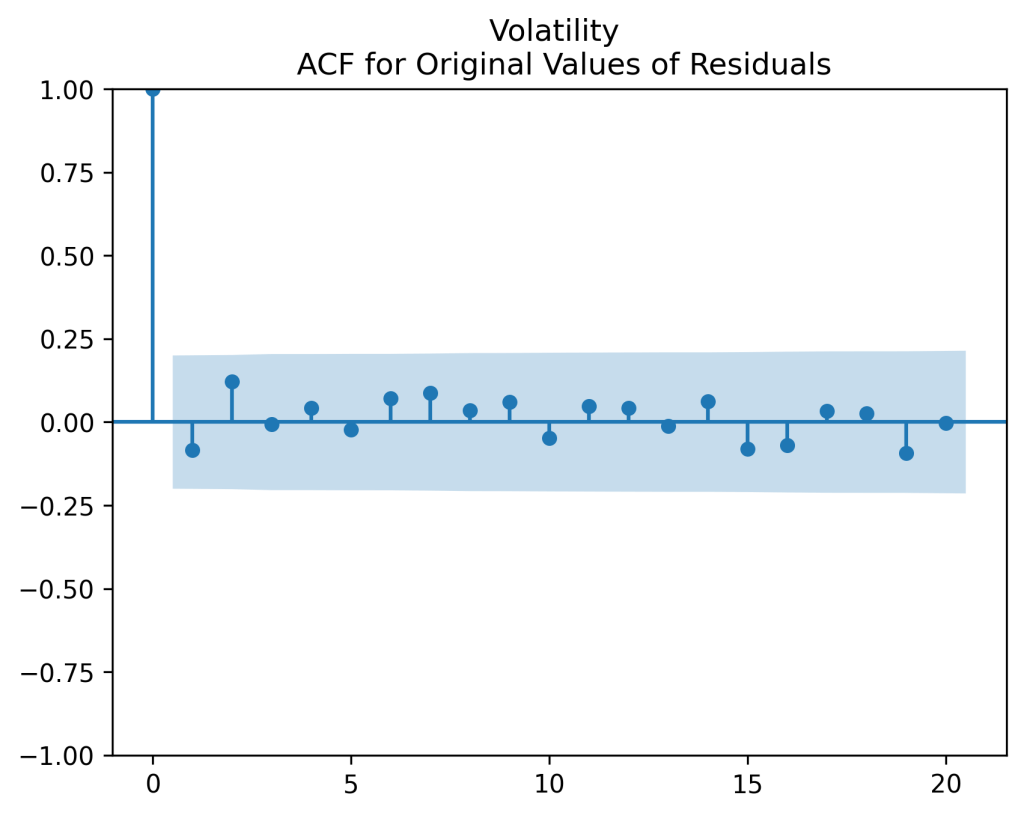
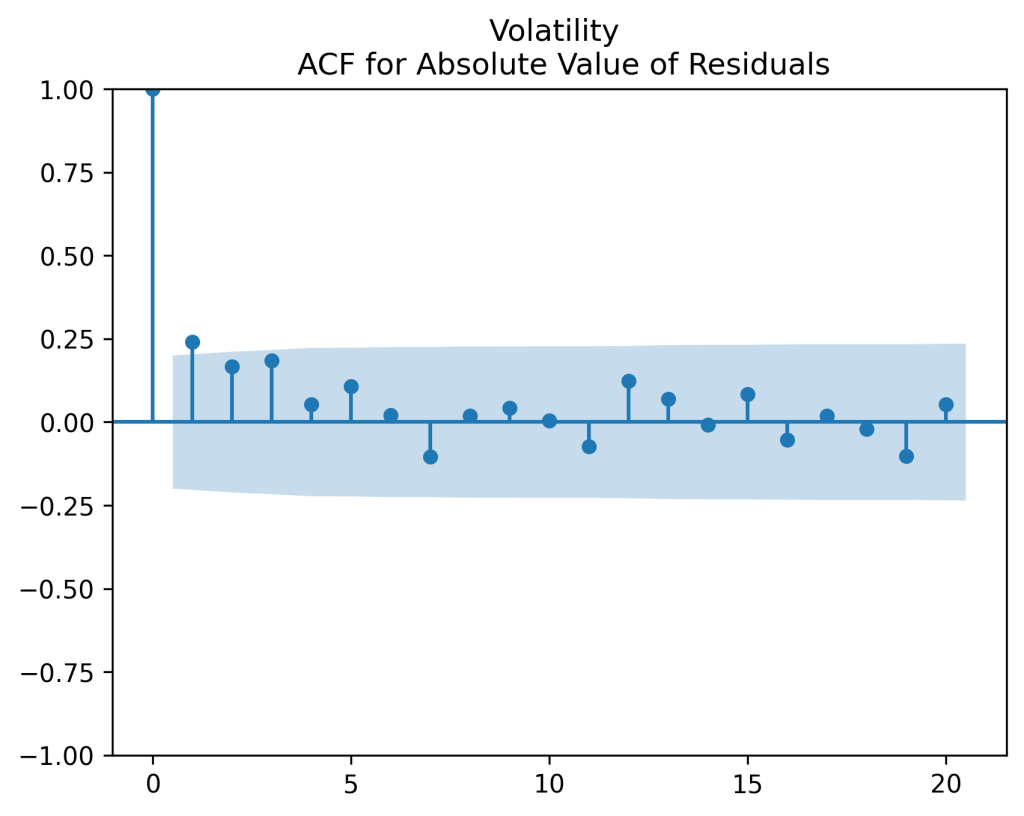
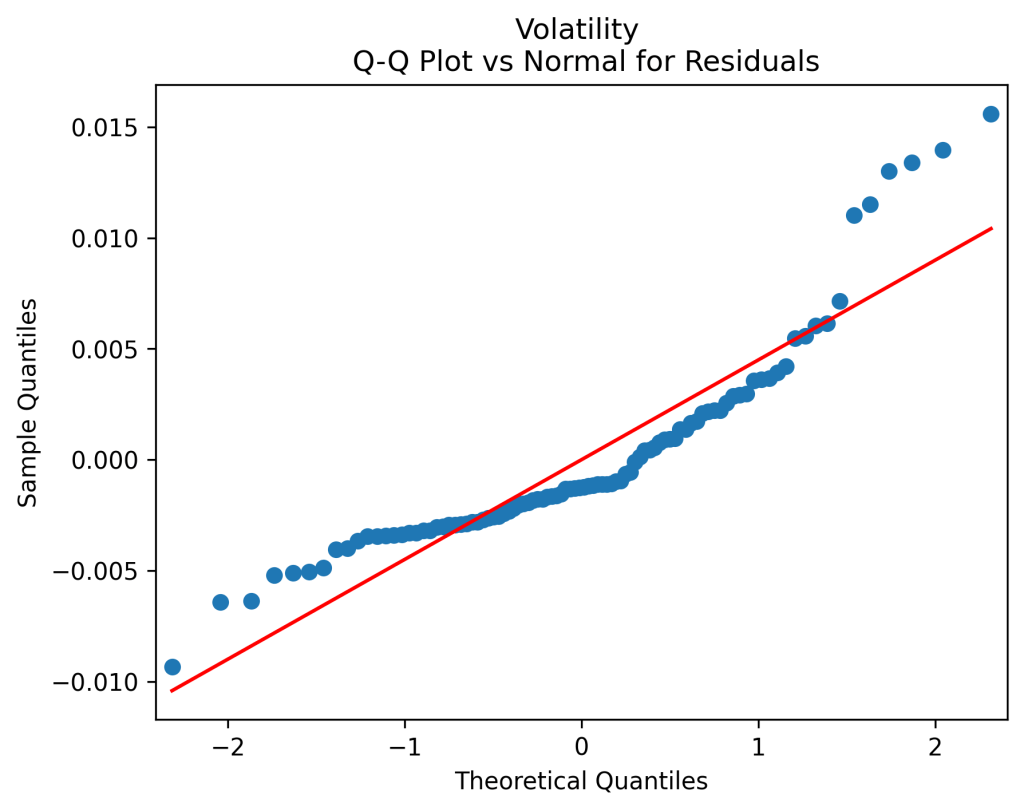
Now let us analyze residuals (innovations)  W(t) which are supposed to be independent identically distributed mean-zero Gaussian:  W(t) \sim \mathcal N(0, \sigma^2). Angel did this by making the autocorrelation function plots for  W(t) and for  |W(t)| , as well as the quantile-quantile plot of  W(t) versus the normal distribution:

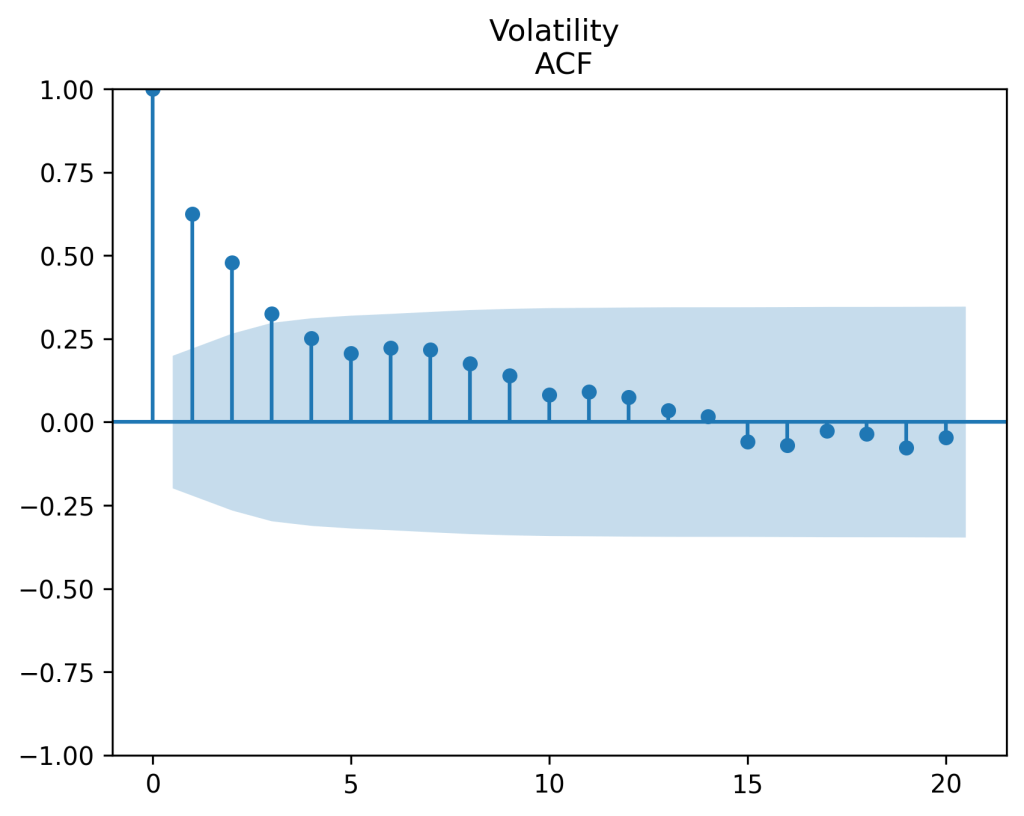
We see that the ACF plot for  W(t) corresponds to white noise but the ACF plot for  |W(t)| does not. A few first lags have significant autocorrelation. Less importantly but also unfortunately, the quantile-quantile plot shows the innovations  W(t) are not Gaussian.

Yet another problem with this Heston model: Volatility can go negative according to this model, but this is impossible in real life. As a standard deviation of market fluctuations, volatility is always supposed to stay positive.

Next, Angel modeled the resulting series  V(t) as an autoregression of order 1 on the logarithmic scale:

 \ln V(t) = \alpha + \beta \ln V(t-1) + W(t).

For updated data,  \alpha = -1.776087 and  \beta = 0.620147 so there is mean-reversion. She did not test for unit root but I am very sure this hypothesis (that  \beta = 1 ) would be rejected.

See the autocorrelation function plots for innovations  W(t) and for their absolute values  |W(t)| which show these  W(t) can be modeled as independent identically distributed. And the quantile-quantile plot versus the normal distribution shows these are Gaussian.

The resulting stationary distribution  \ln V(\infty) is Gaussian with mean -4.68 and variance 0.218. Using the moment generating function for the normal distribution, we can compute  \mathbb E[V(\infty)] = 0.0104 and variance  \mathrm{Var}(V(\infty)) = 1.34\cdot 10^{-4}.

Updated data for 1928-2024 volatility, nominal and real returns, and index prices, can be found on my web site

The code and data for the current post can be found on https://github.com/asarantsev/Annual-Volatility

Published by


Responses

  1. New Bubble Measure Replicated with Stochastic Volatility – My Finance

    […] is the work by my undergraduate student Angel Piotrowski. She used her annual volatility data 1928-2024 to replicate my previous work published on arXiv and discussed in my previous blog entry about the […]

    Like

  2. Make S&P Returns IID Gaussian – My Finance

    […] volatility for 2024. The resulting series 1928-2024 is still well modeled by log Heston model, see another post. The research in this post is done in GitHub/asarantsev […]

    Like

  3. Investment-Grade Corporate Bond Returns 1972-2024 – My Finance

    […] back to 1986. Thus we need another version of annual volatility. Luckily, Angel Piotrowski provided annual realized volatility for S&P 500 (and its predecessor, S&P 90). This code and data is available on GitHub/asarantsev repository […]

    Like

  4. Annual Volatility for Standard & Poor 500 – My Finance

    […] See updates here. […]

    Like

  5. Earnings Growth/Volatility vs Rates and Spreads – My Finance

    […] the annual realized volatility computed by another undergraduate student Angel Piotrowski. Denote it by and divide by it the […]

    Like

  6. Financial Simulator, Annual Version – My Finance

    […] do not have any bond rates or spreads, any earnings or dividends. We have only annual volatility, previously computed by Angel, and total returns data, available on my web page. The code and data are also available on […]

    Like

  7. Vector autoregression with volatility for two spreads – My Finance

    […] 1, with mean reversion in the long run, if only we divide innovations and by annual volatility, computed by my other undergraduate student Angel Piotrowski. Then are independent identically distributed bivariate […]

    Like

  8. Stock Returns vs Earnings Yield and Two Spreads – My Finance

    […] we add annual realized volatility which we add both additively to the linear regression, as a factor, and multiplicatively, to the […]

    Like

  9. Earnings Yield, 3 Bond Spreads, Annual Returns – My Finance

    […] Annual realized volatility of Standard & Poor 90/500 (1928-2024) daily log returns for year […]

    Like

  10. New Valuation Measure Replicated + Volatility – My Finance

    […] innovations: Next, let us divide innovations by annual volatility computed by Angel Piotrowski. The result is better: These are independent identically distributed Gaussian. Strange high […]

    Like

  11. Simulator of S&P Returns using volatility only or with Shiller CAPE – My Finance

    […] Annual realized volatility only, computed by my undergraduate student Angel Piotrowski […]

    Like

  12. Simulators – My Finance

    […] Volatility only, see this blog post and GitHub repository […]

    Like

  13. Using both new valuation measure and CAPE – My Finance

    […] ratio (Shiller CAPE) with averaging window of 5 or 10 years. We also use, as usual, the annual volatility. Instead of this Shiller CAPE, we use its inverse, which we call simply the yield. We call the new […]

    Like

  14. To Do List – My Finance

    […] and corporate bond returns. Previously, we modeled large stock returns (measured by S&P) using annual volatility and the new valuation measure. We also used bond spreads but not rates, including them in our […]

    Like

  15. Updated Simulator for Rate and Volatility – My Finance

    […] use the following autoregression equation for annual volatility for S&P 500 and its predecessor, S&P 90, computed by Angel […]

    Like

Leave a reply to Updated Simulator for Rate and Volatility – My Finance Cancel reply