This post is continued from the previous post, which in turn continues the two posts of annual Bank of America-rated bond rates and returns. We fit the 1996-2024 data for corporate bond returns and rates.
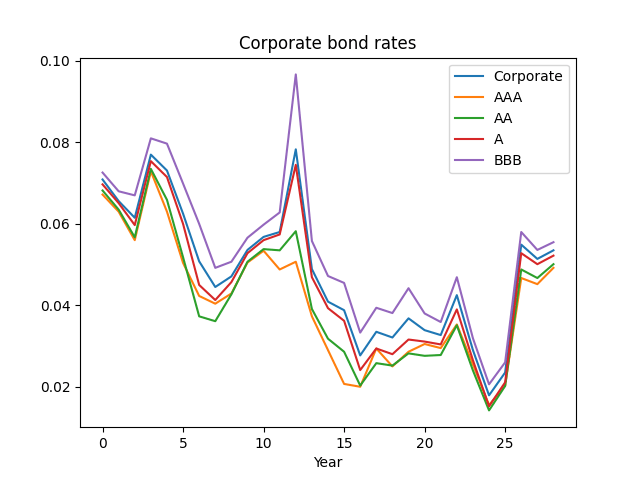
Here, we talk about investment-grade corporate bonds in general, combining all four investment-grade ratings: AAA, AA, A, BBB. Below see the graph of these corporate bond rates, together with rates of each ratings of investment-grade bonds: AAA, AA, A, BBB. We see that investment-grade rates are closer to A or BBB, rather than AAA.
Next, plot the wealth. Then we see the same pattern. We are curious why investment-grade corporate bonds behave closer to lower-rated investment ratings, rather than AAA? Maybe there are not so many AAA rated bonds.
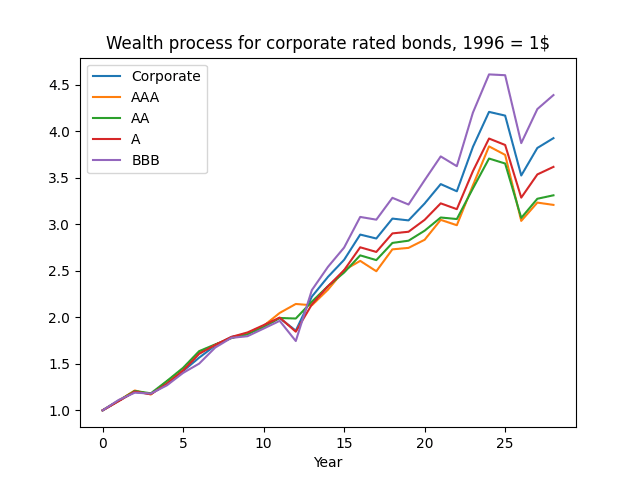
This might be the reason why in this post AAA rates do not predict corporate bond returns very well. Remember, we have data for Bank of America bond rates only from 1996 (end of year).
We have Bank of America investment-grade corporate bond returns starting from 1972. This discrepancy gives us motivation to use end-of-year weekly data for Moody’s AAA or BAA (which corresponds to BBB in Bank of America ratings) available from 1962 to predict investment-grade corporate bond returns. This gives us motivation to replace AAA with BAA Moody’s rates.
Using the cut data from 1996, we replicated results of annual Bank of America-rated bond rates and returns. The results are the same as for AAA, AA, A, or BBB. Using annual volatility makes the two regressions have IID Gaussian residuals. All is good, except the rates are available only from 1996.
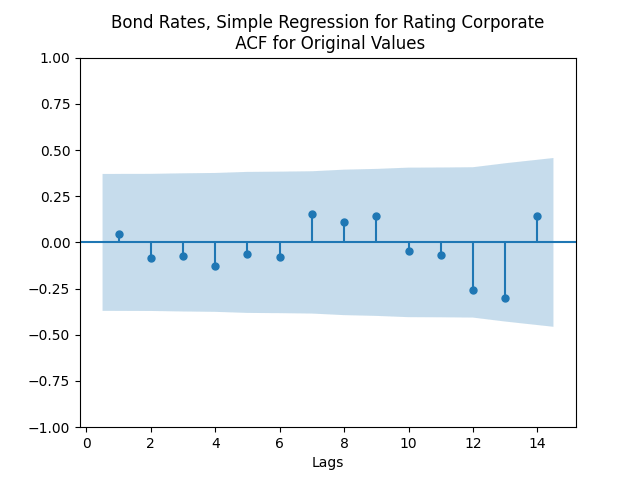
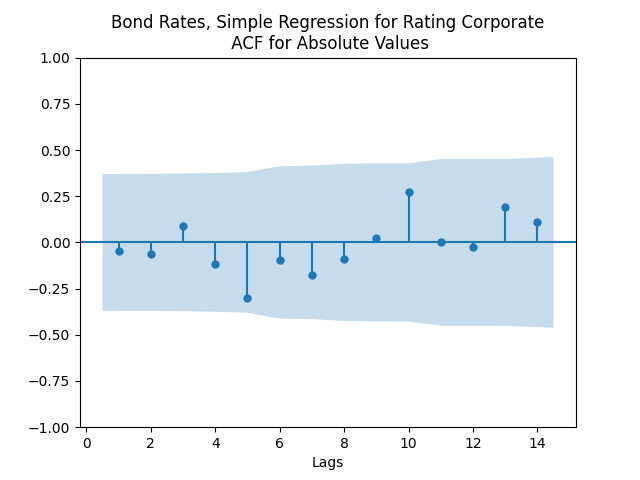
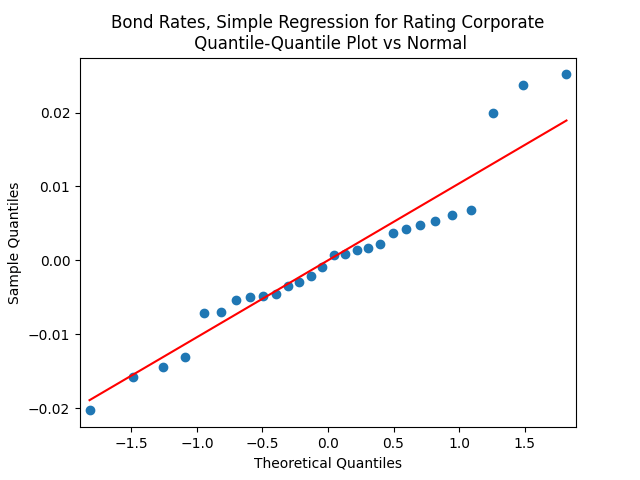
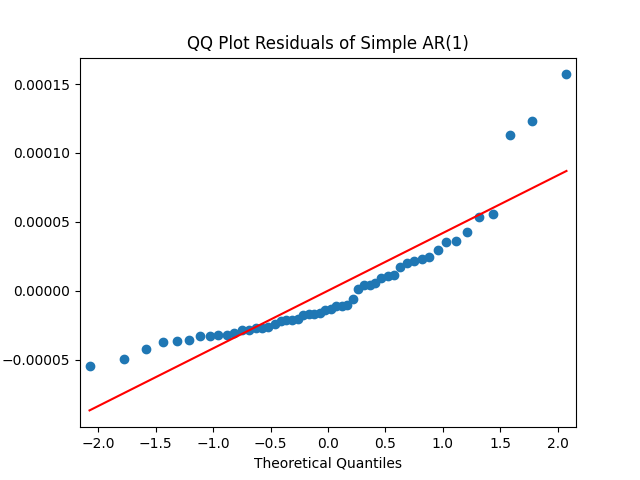
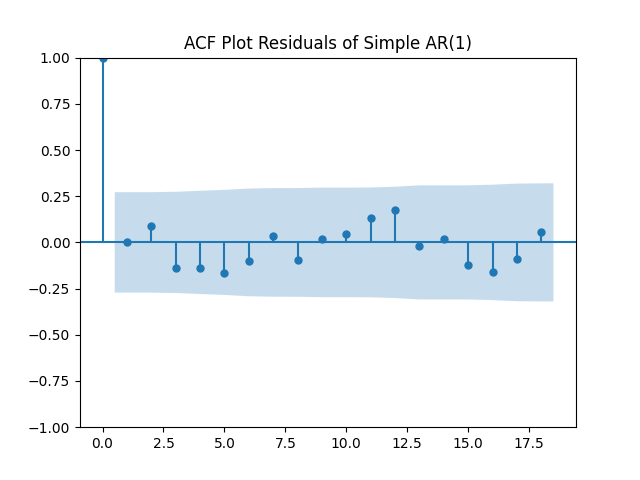
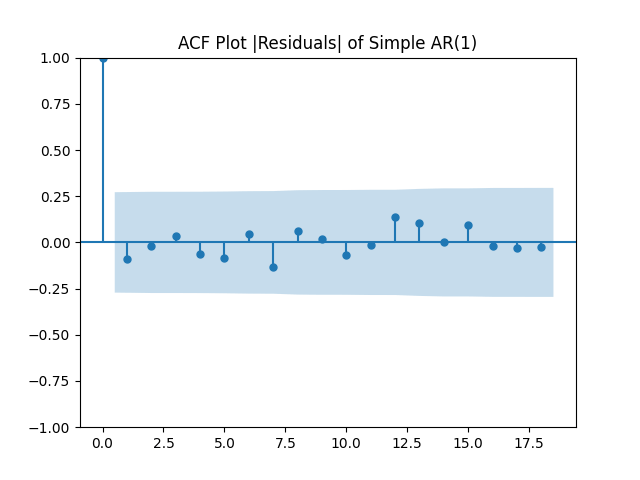
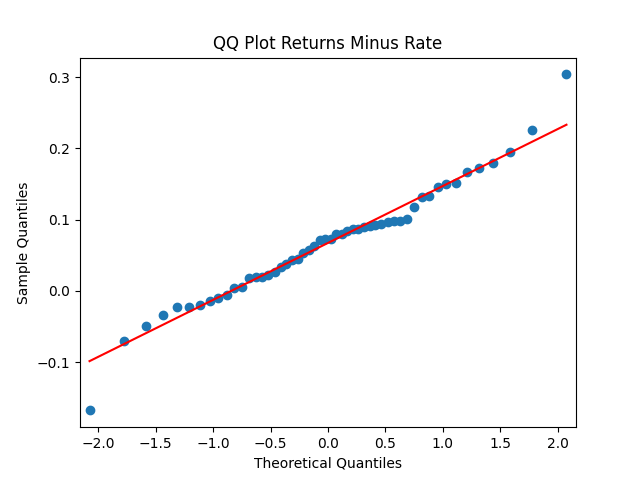
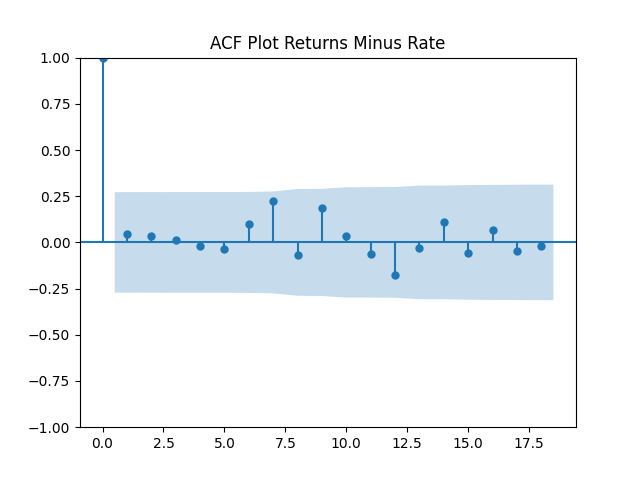
Here analysis of simple autoregression residuals for rates show they are IID but not Gaussian.
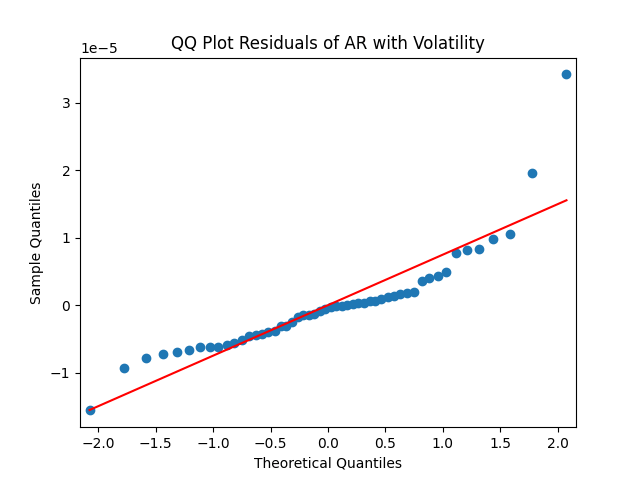
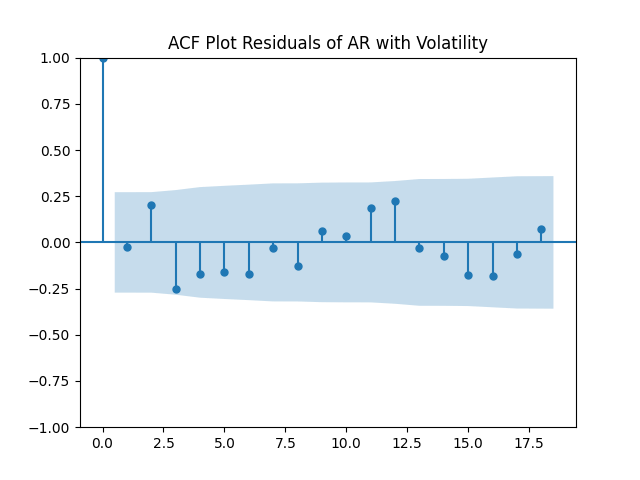
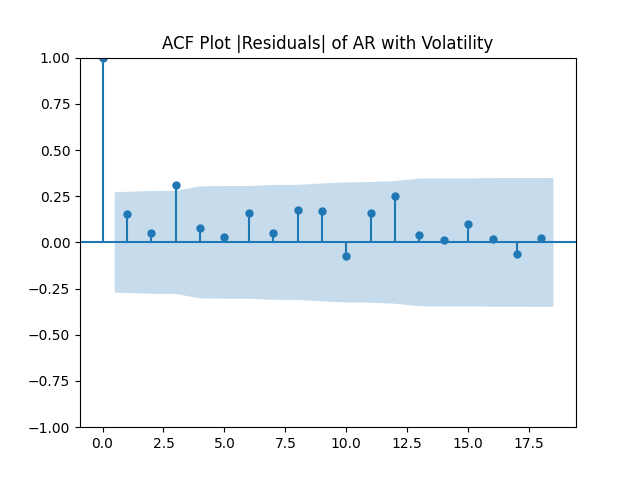
But autoregression with volatility: 


Model total bond returns 

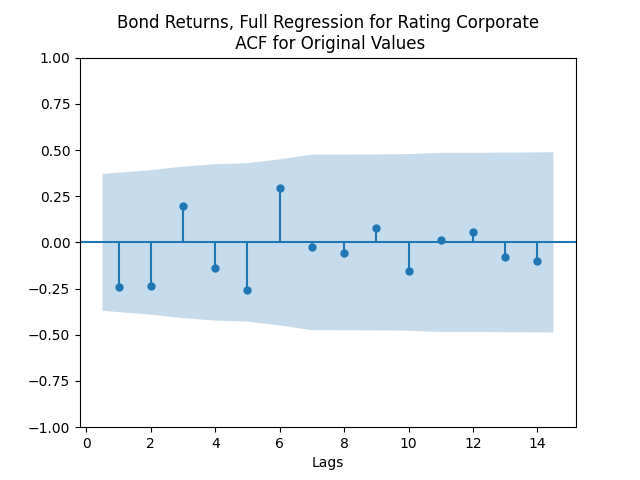
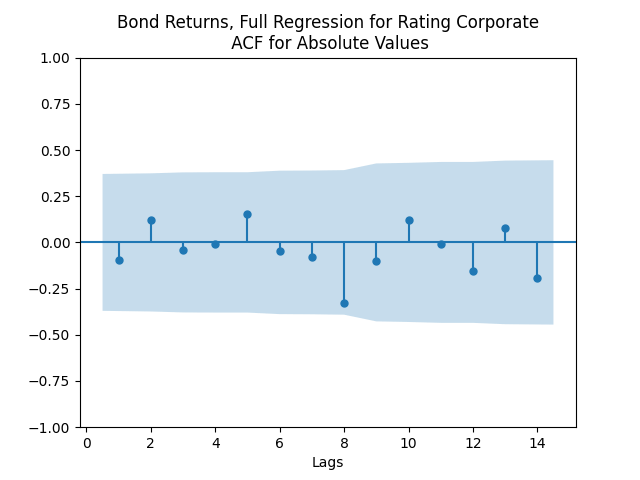
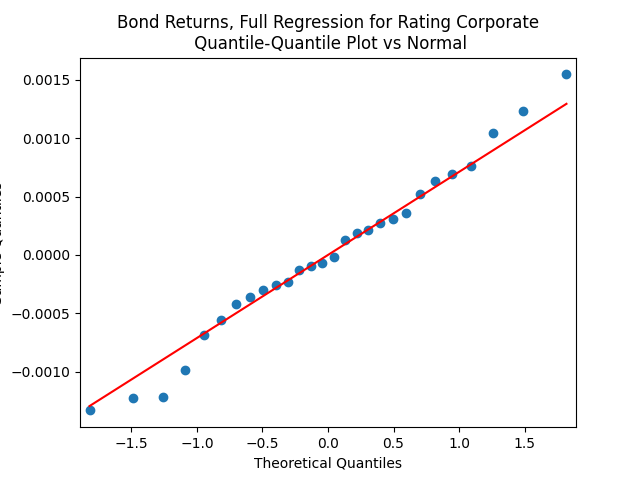
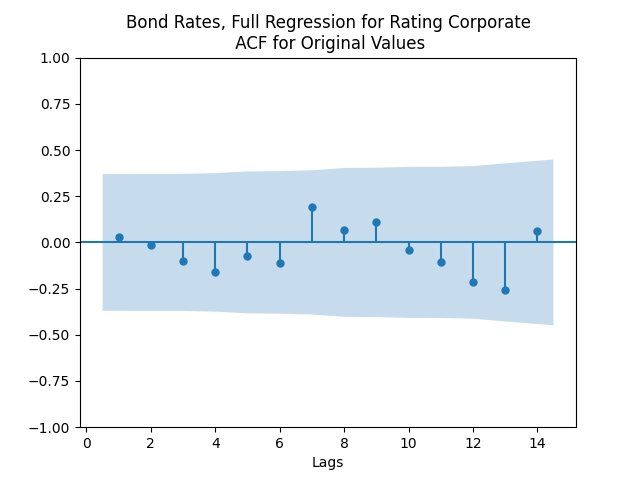
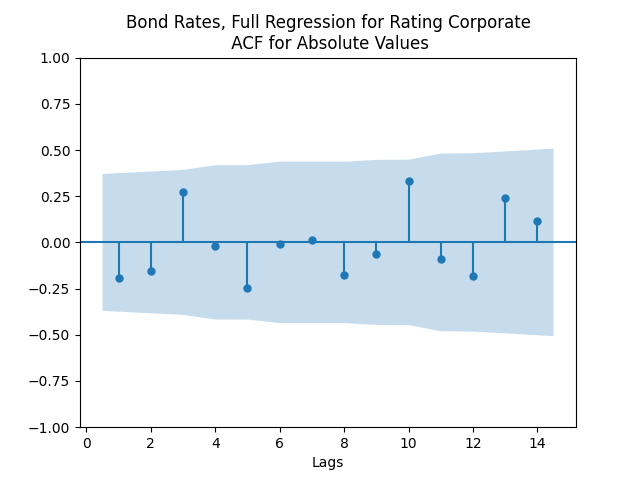
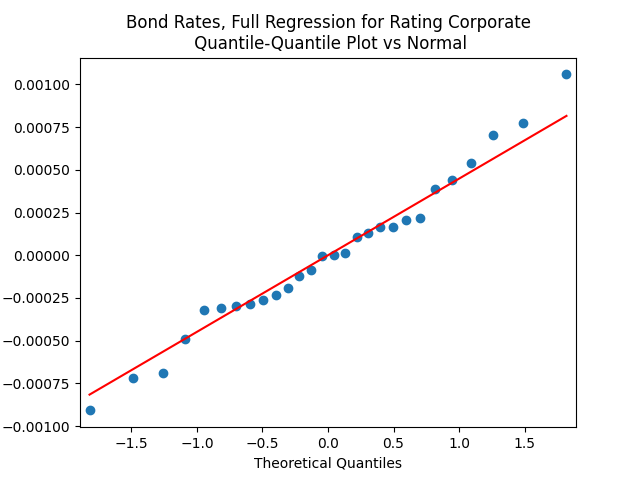
But for the simple regression without volatility 
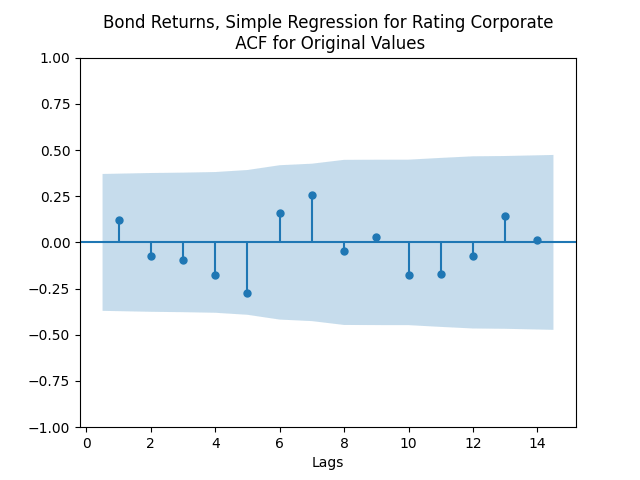
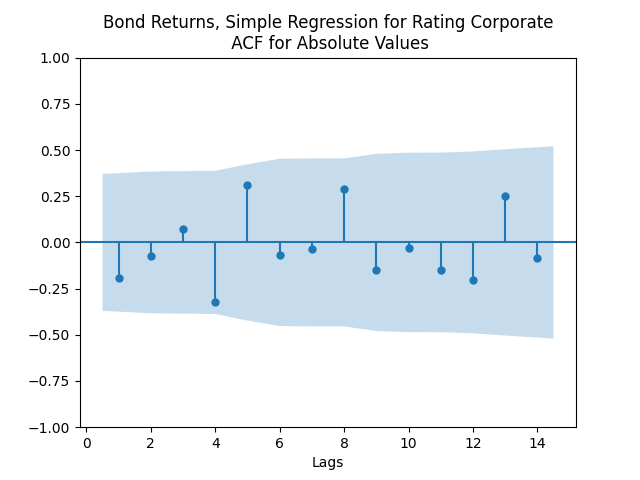
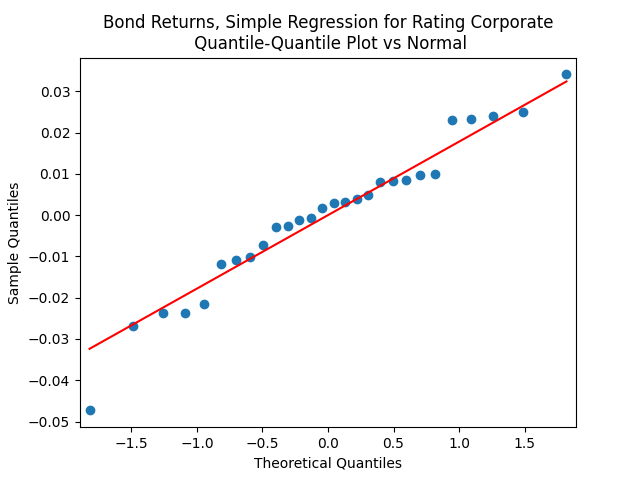
Both regressions actually have IID Gaussian residuals, judging by Shapiro-Wilk and Jarque-Bera normality tests, and the L1 values for autocorrelation function. For the simple regression, 


Next, let us replicate results of this blog post for BAA instead of AAA rates. We uploaded updated code to GitHub/asarantsev repository Corporate-Bonds-Annual-Data. We have data from 1972.
The simple autoregression for rates 

Look at residuals for autoregression for rates with volatility: 
For the simple autoregression, Shapiro-Wilk and Jarque-Bera tests give us 


But it’s good to regress these differences 


Leave a reply to To Do List – My Finance Cancel reply