S&P Returns vs 3 Spreads with Volatility

This is the continuation of the research in this main post and addendum post. We remove earnings yield from regression for stock index returns. The rates-only.py code is from GitHub/asarantsev repository 3spreads-CAPE-simulator

Consider annual S&P returns  Q(t) (price/total, nominal/real)

 Q(t) = a + \sum_{i=1}^3b_iS_i(t) + cV(t) + V(t)Z(t).

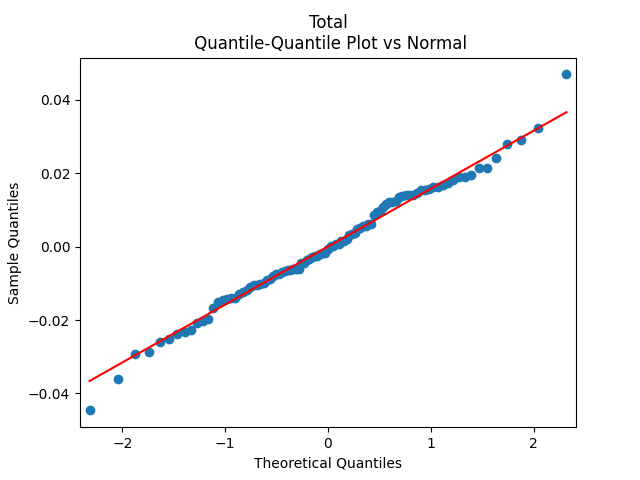
Standard analysis of residuals  Z(t) explained in this main post shows they are well modeled as independent identically distributed Gaussian. All  b_1, b_2, b_3 are not significant: Student T-test has p-values greater than 5%. The most significant (having the smallest p-values) is  b_1 corresponding to the BAA-AAA spread. Exceptions: for Total Nominal Returns,  b_1 has  p = 3.3\%. The coefficient  c < 0 is very statistically significant with  p < 0.15\%. See below the graphs for simulated volatility and spreads.

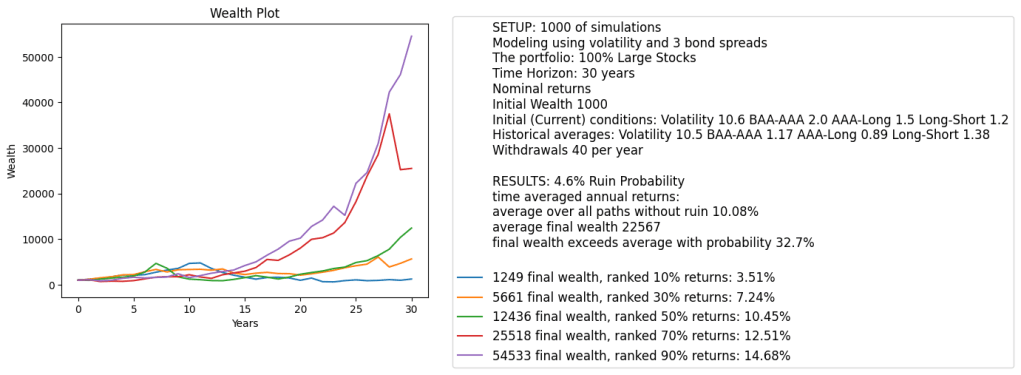
We added to this GitHub repository the entire simulator for the rates-only model (with annual volatility, of course). It is done in Python file rates-only-sim.py in the same repository. See below the graph.

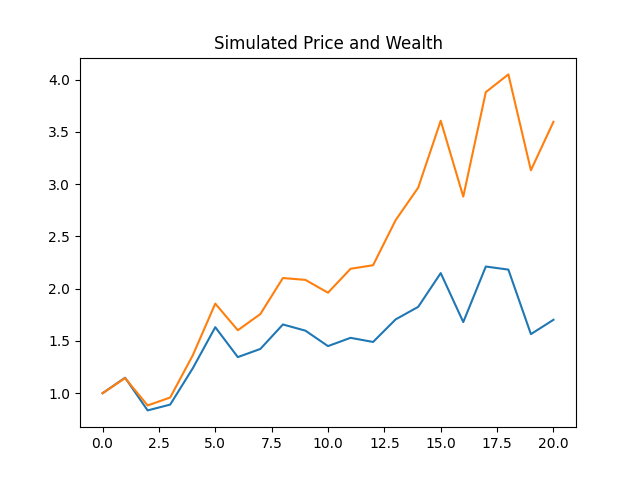
Below we show one simulated path of prices and wealth. This simulation is for the case of real (inflation-adjusted) version and 20-year horizon.

Finally, pick  Z(t) for the case of total nominal returns. Below we see the autocorrelation plot for  Z(t) , for  |Z(t)| , and the quantile-quantile plot for  Z(t) versus the Gaussian distribution.

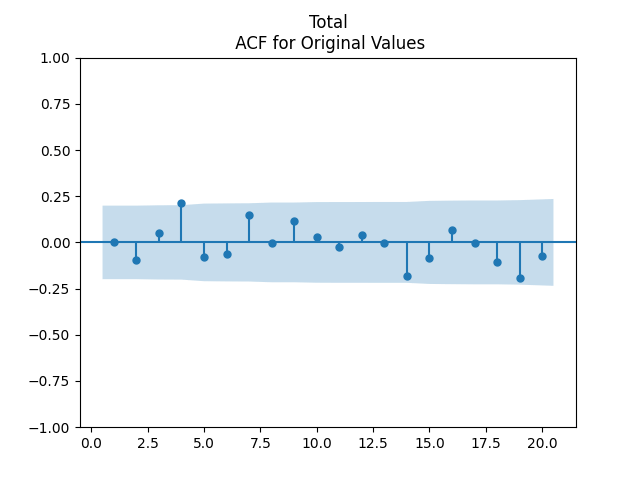
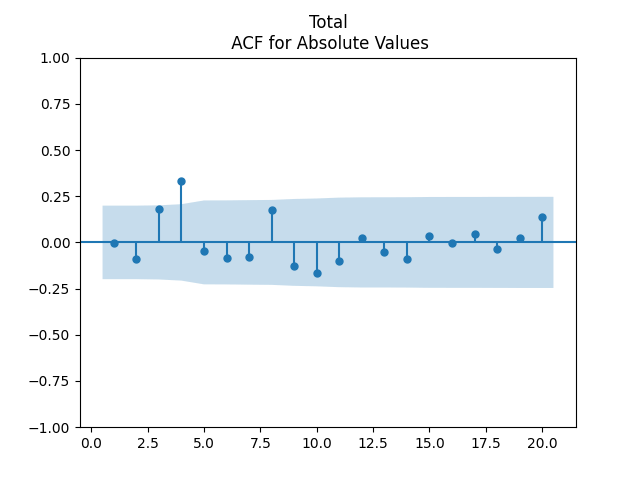
As before, we have this strange value at lag 4 for autocorrelation. This presents no problem, since other values are low.

Published by


Response

  1. Simulators – My Finance

    […] Volatility and three spreads: BAA-AAA, AAA-Long, Long-Short, see this GitHub repository files only-rates-sim.py and only-rates.py […]

    Like

Leave a reply to Simulators – My Finance Cancel reply