Continuing the previous blog, I wrote combined simulator for Standard & Poor 500 annual total returns with two options:
- Annual realized volatility only, computed by my undergraduate student Angel Piotrowski
- Volatility + earnings yield, earnings is averaged over the last few years. Averaging window ranges from 1 to 10 years.
I do not think combining these simulators in one Python code file works well. Indeed, when you add more and more features and options, it becomes harder to manage them. Better to create multiple Python files for each option. In the main Python file we can import all other files and organize input of options. If a user chooses an option, the main Python file should redirect to another Python file which does computation for this chosen option.
But I uploaded the Python code to GitHub/asarantsev repository earnings-yield-annual-simulator.
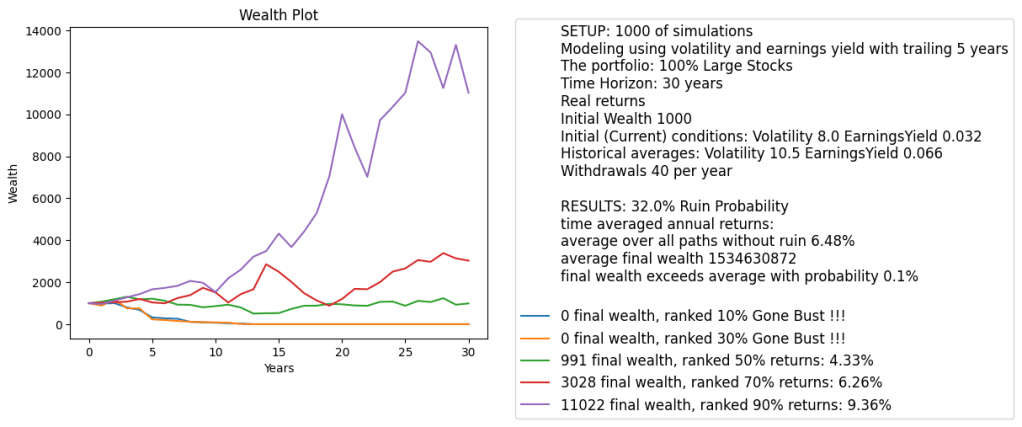
Setting: Withdrawals 40 per year: 4% of the initial capital (inflation-adjusted). Time horizon is long: 30 years. As before for cyclically adjusted price-earning ratio: CAPE, we do not allow the choice of initial conditions: We pick them to coincide with current (as of December 2024) market conditions.
Results: Cyclically adjusted earnings yield currently is much lower than historical average. This is equivalent to CAPE being much higher than historical average. This implies lower future returns than historically, and higher ruin probability.
We can also see high variance of final wealth: Greatly skewed to the right. A few top simulations have huge wealth. This might be due to including earnings yield, instead of its logarithm. Then the time series model (in continuous time this would be a stochastic differential equation) for total returns has an exponentially increasing drift.
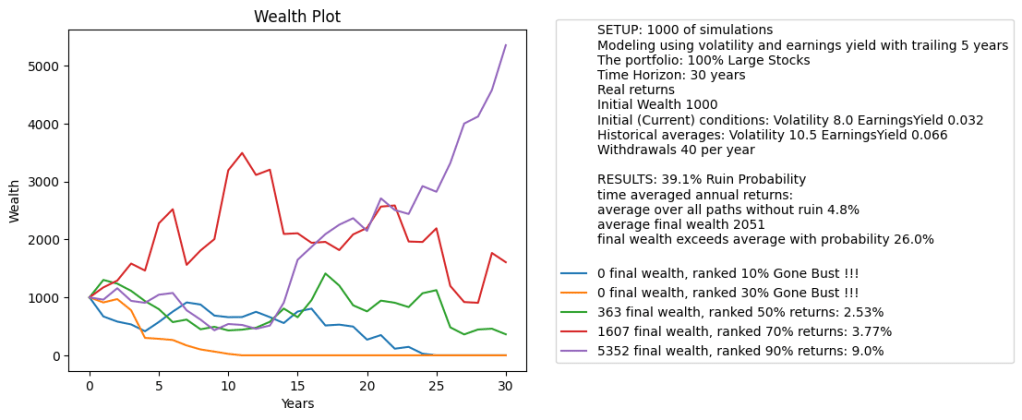
Modification: Let us change the earnings yield factor to its logarithm in regressions for price and total returns. Then the variance of final wealth is much less, and less skewed to the right. That is, unrealistic very high wealth outliers are much less likely. See below the graph. But returns are still much lower than for historically average earnings yield. We still refer to the same GitHub/asarantsev repository earnings-yield-annual-simulator.

Leave a comment