Continuing the research in the blog post and using the Python code from my GitHub repository, I made a simulator of the Standard & Poor 500 annual total returns using the new valuation measure and annual volatility with inputs: Nominal or Real, and averaging window ranging from 1 to 10 years. We can input time horizon, withdrawals/contributions, choice for innovations simulator: kernel density vs multivariate Gaussian law, and initial wealth, for the simulation. This is similar to the combined simulator for volatility and cyclically adjusted earnings yield: see this post and this post. We do not allow the user to choose initial conditions for the simulator, instead making them to be the current (as of December 2024) market conditions.
We consider the regression for 


After going back to the original formulation, this intercept term would become the factor of volatility:

Comparing the two regressions, we see that 
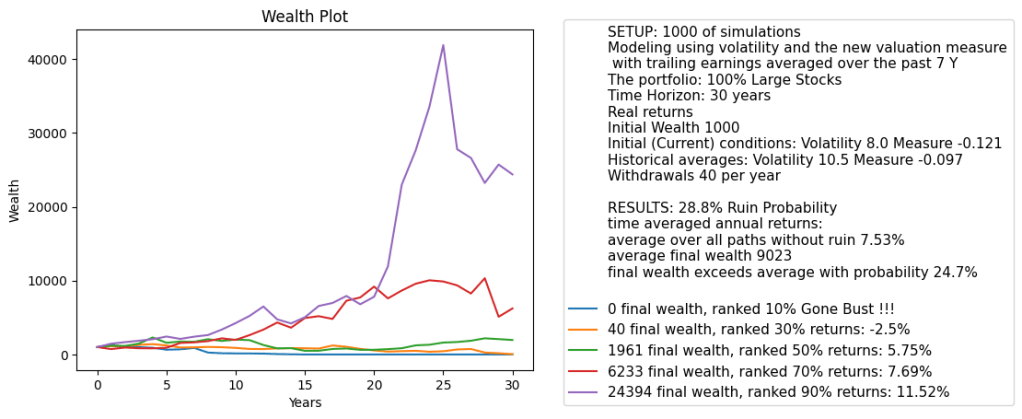
Below we see the results plot for this simulator. We pick 7-year averaging window and 30-year time horizon. The current measure is lower than historical average. This is the opposite of CAPE which shows that currently (as of December 2024) the S&P 500 is overvalued. We see that the variance of the terminal wealth is not very large, compared with the CAPE-volatility model with log(earnings yield) as factor instead of earnings yield in this post.
We need to do the following actions:
- Allow for a version of this simulator with 1-year earnings (no averaging) to choose the initial valuation measure and annual volatility. For 2-year and wider averaging windows we do not allow this, because picking earnings for each of 2 or more last years is too complicated for the user.
- Present a table for all averaging windows, how good is regression fit?
and
values for Student T-test. Are innovations Gaussian or independent identically distributed? If the regression fit is not good, according to these metrics, we can prohibit the user to apply these choices for averaging windows.
- Include the volatility in the main regression, that is, the coefficient
Presumably we need to adapt the autoregression simulation for that. Also, analyze the innovations and see whether this is a good fit. If not, again prohibit the user to apply these options.
This would complete the research for earnings. But we also need the bond spread analysis. This is left for further research: To build a simulator and to include trailing averaged earnings for more than one year. But then you should not allow the user to change these earnings. Maybe it’s OK to choose volatility or bond rates (which lead to bond spreads).

Leave a reply to Simulators – My Finance Cancel reply