This is yet another version of the financial simulator. See my GitHub/asarantsev repository CAPE-Volatility.
We have annual volatility and earnings as two factors, as in the previous post. We here use trailing averaged annual earnings over a few years instead of earnings over the last year. This averaging time window ranges from 2 to 10 years. This is similar to the 10-year trailing averaged earnings used in the Shiller cyclically adjusted price-earnings ratio. The inverse of a price-earnings ratio is called earnings yield.
Model: The equations from the previous post stay the same. We model earnings growth normalized by volatility for 1-year earnings. But for the returns, regression has trailing averaged earnings. The data are the same: earnings and inflation for 1927-2024, returns and volatility for 1928-2024. But we add a few data points for earnings and inflation for years 1918-1926. Indeed, we need to compute 10-year averaged earnings, and thus we need a few more trailing data. The data is from my web site.
We take real and nominal earnings and returns. We have 4 types of returns: nominal total, nominal price, real total, real price.
Modification: But then we have a problem with initial conditions. Assume we take a 10-year window. To get earnings yield for year 


It is not enough to provide only earnings for the last year, or averaged earnings over the last 10 years. These initial conditions would not be sufficient to perform the simulation. We think it would be hard for a user to provide all earnings for each of these 10 years.
Thus I made the following decision. I simply removed the option of choosing initial earnings. The simulator always uses the earnings for the actual last 10 years. The same is true for volatility. We start the simulation from the actual year 2025.
Results for 10-year window: Dependence of returns upon earnings yields is much stronger than in the previous post: 

Residuals for regressions of returns are normal. Autocorrelation function plots seem better, although still with a strange spike at lag 4.


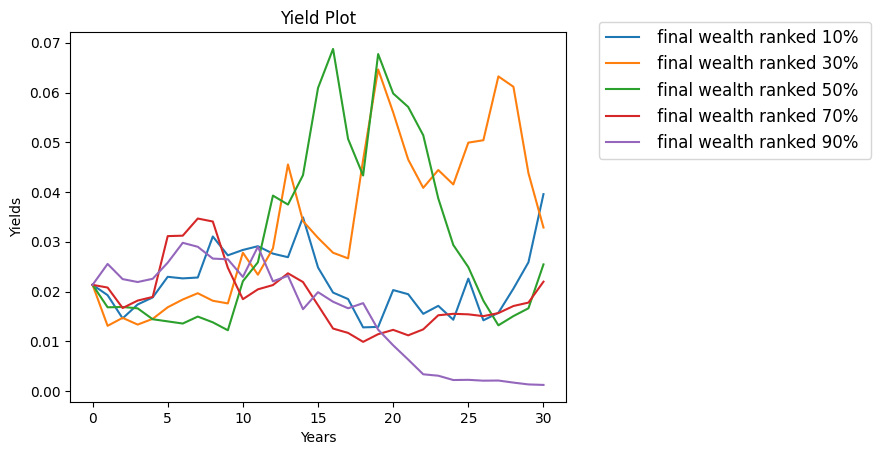
Simulations show the earnings yield can fluctuate but not nearly as wildly as in the previous post. The picked simulations have yields less than 7%. See the plot below.
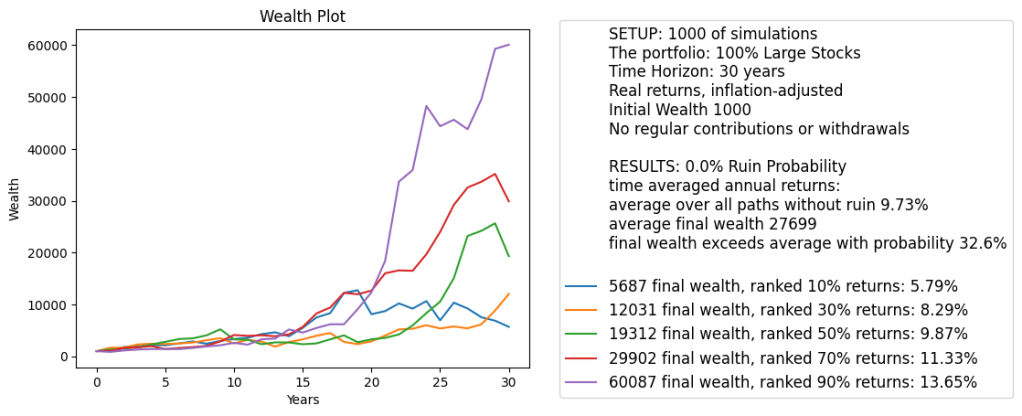
Finally, the wealth simulation fluctuates much less. We try 30 years time horizon without any withdrawals or contributions. Overall average returns are more reasonable 9.63%. More importantly, the 90% quantile of average total returns is only 13.65%, much less extreme than in the previous post.
Conclusions: We think the Shiller CAPE, or, equivalently, cyclically adjusted earnings yield with 10 years of averaging window works much better than the annual price-earnings ratio, or equivalently, annual earnings yield. We added annual volatility to the classic Campbell and Shiller’s research and much improved it. Now we have a dynamic stochastic general equilibrium (DSGE) model: We can simulate it for each time step; It is stable in the long run; and it has Gaussian IID innovations.

Leave a reply to Combined Simulator of Annual S&P Returns vs Volatility + (maybe) Earnings Yield – My Finance Cancel reply